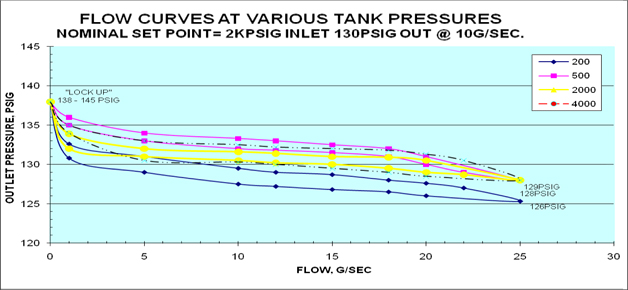
These flow charts are empirical data from a flow bench with the outlet pressure sensor located four feet away from the regulator. Outlet in between the mass flow meter 6 feet away connected with ½” SS tubing flowing to atmosphere. Charted are resulting pressure with continuously increasing flow at coincidental points decreasing flow.